Bitvore has a complex and exhaustive system for identifying critical information in news. We look at 1M or more individual news stories per day and analyze them with our battery of AI models, filters, and natural language processing to identify only the most important business news for our clients. We identify when something important happened in our system through what is called a 'signal'.
Signals are hierarchical and represent important occurrences in the market that are material to the health of a company, municipal bond or other asset. For instance, in the Technology economic sector, there is a signal called 'Legal Issues'. One type of legal issue is patent and trademark infringement. We can analyze economic sectors, industry NAICS codes, or even individual public or private companies for the frequency of certain types of signals over time.
It's also interesting to benchmark or watermark industry trends like higher-than-usual executive churn, cross-industry financial health issues, greater borrowing, more mergers/acquisitions and partnerships/agreements, and launches of new products and markets. Getting a feel for how these things change over time isn't easily captured in a spreadsheet, so we often use visualizations to figure out how and when things change.
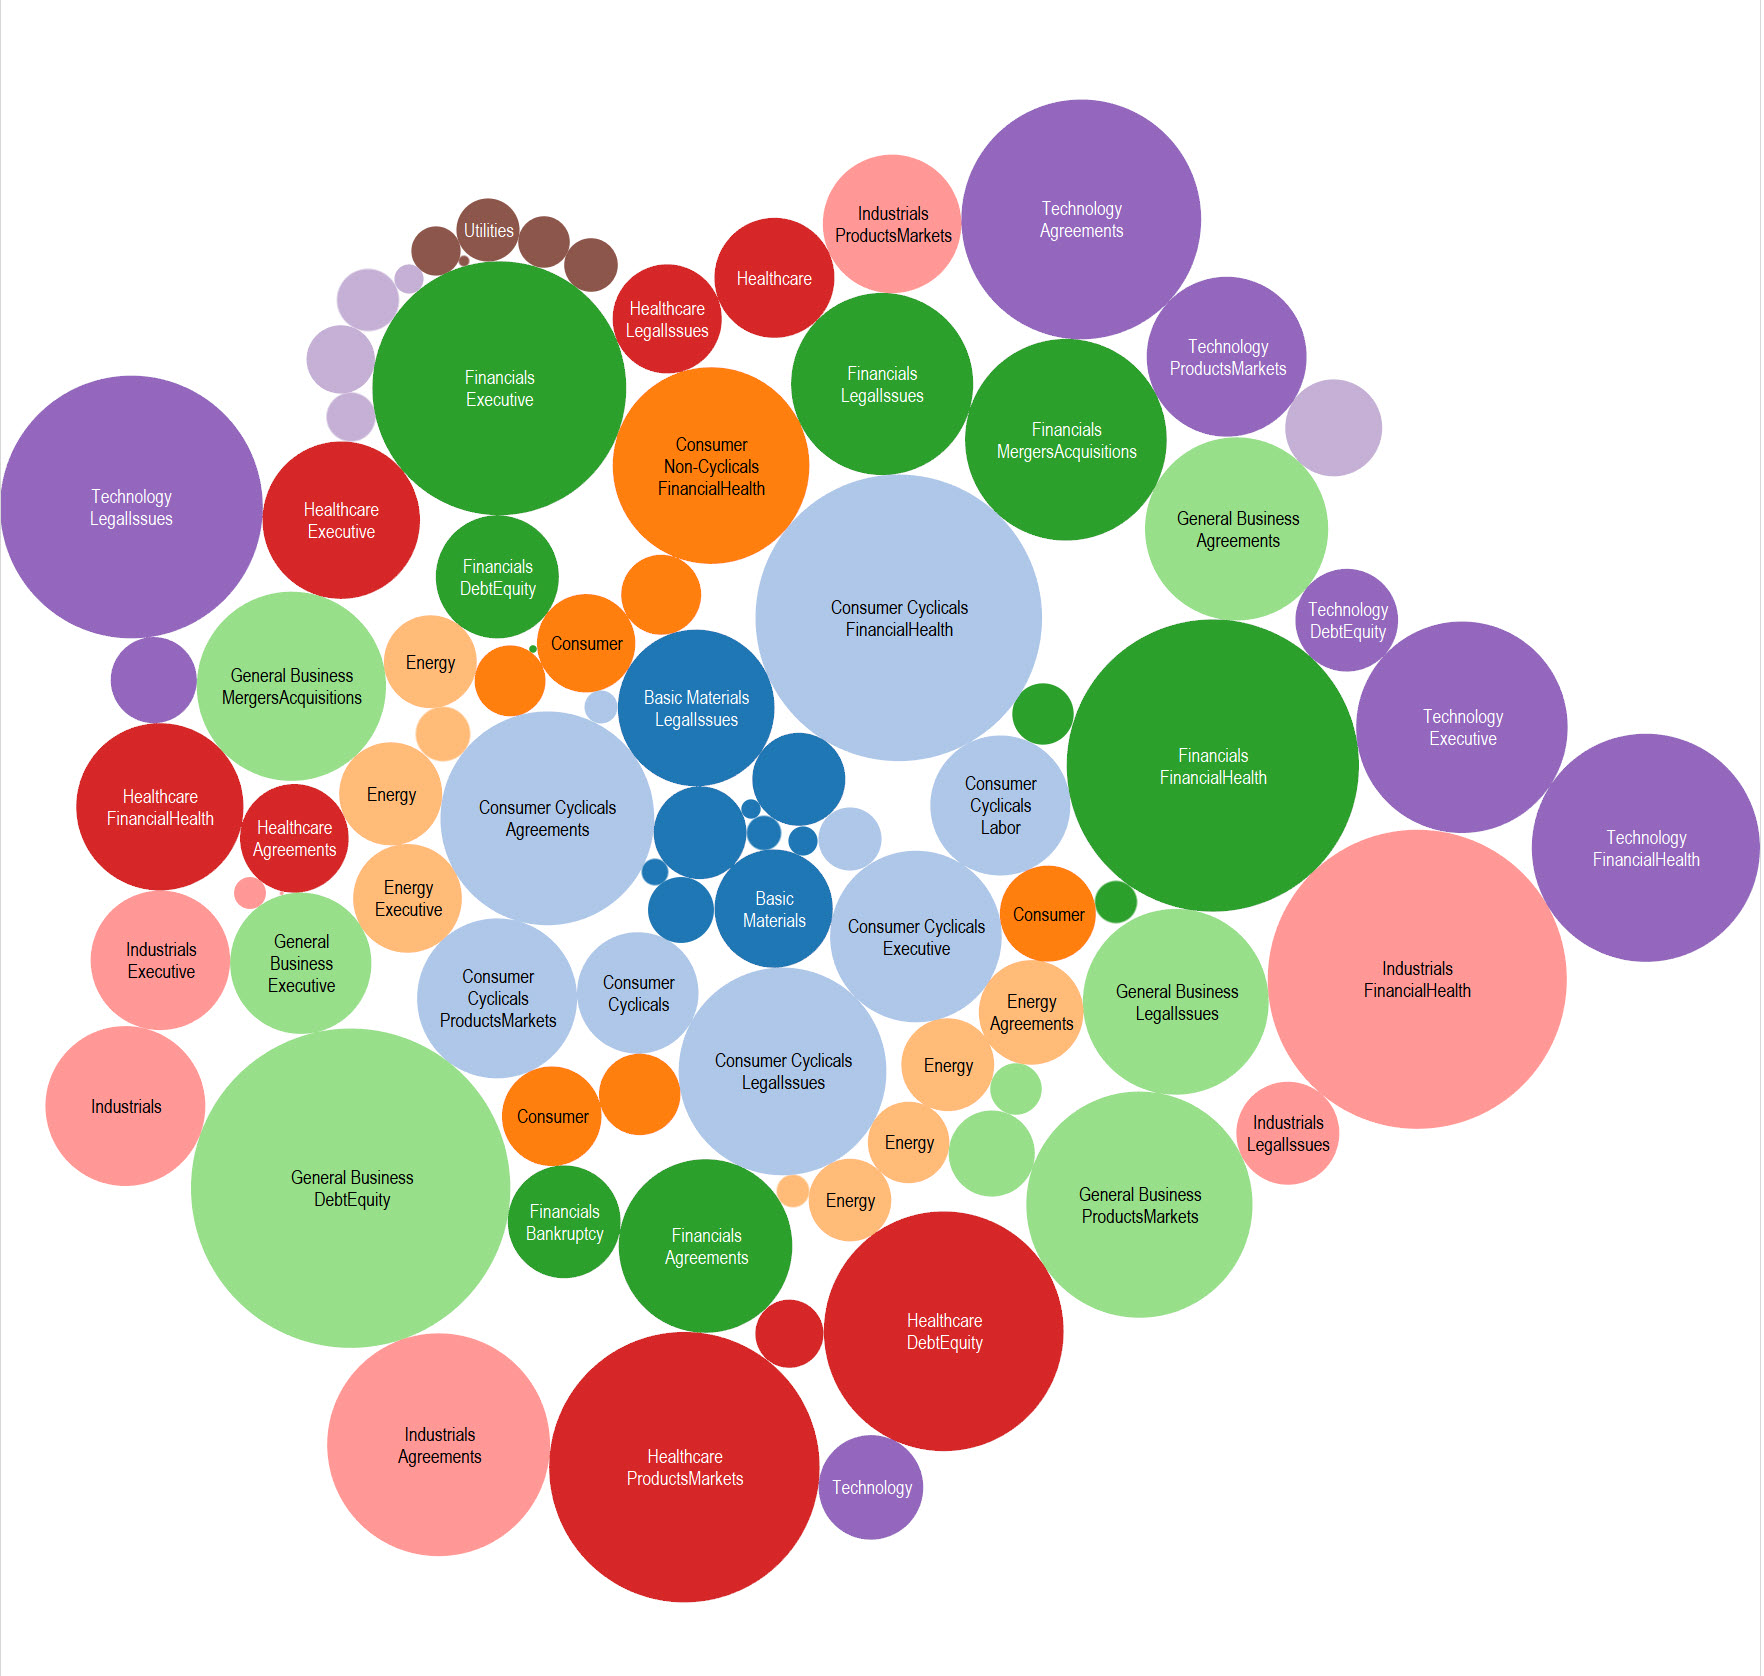
Below is a visual of the relative amount of signals within an economic sector colored by that sector. This makes it easier to get an intuitive sense of how the different sectors compare and contrast with respect to critical business signals over a period of time.

From our graph, we can tell that we're in a period of Healthcare innovation as they are launching new products and going into new markets, raising debt equity to do so.
Likewise General Business is using debt equity to grow, the Financial industry is going through a significant amount of executive changes, and Technology companies are encountering many legal issues and making a lot of agreements.


